酷暑日 (Kokushobi): Japan Names Its Cruellest Days
Japan has a word for almost every gradation of summer heat. There is natsubi (夏日) — a summer day, when the mercury clears 25°C. Then manatsubi (真夏日), a midsummer day, at 30°C. Then mōshobi (猛暑日), a fierce-heat day, at 35°C. For decades that was the top of the scale. It no longer is.
After the summer of 2024 — Japan’s hottest on record — the Japan Meteorological Agency (JMA) ran an online public survey to name something the existing vocabulary could not adequately describe: a day when the temperature reaches or exceeds 40°C. The winner, chosen from thousands of submissions, was 酷暑日 (kokushobi).
What the word means
Break the kanji apart and you get the full force of it:
| Kanji | Reading | Meaning |
|---|---|---|
| 酷 | koku | cruel, harsh, severe |
| 暑 | sho | heat, summer warmth |
| 日 | bi / nichi | day |
酷 is the same character used in zankoku (残酷) — brutal, atrocious. The agency did not reach for a polite euphemism. A kokushobi is, literally, a cruelly hot day.
The naming follows a long Japanese tradition of giving precise meteorological vocabulary to atmospheric states that other languages treat as a single undifferentiated “hot”. The full ladder now looks like this:
| Term | Kanji | Threshold | English gloss |
|---|---|---|---|
| Natsubi | 夏日 | ≥ 25°C | Summer day |
| Manatsubi | 真夏日 | ≥ 30°C | Midsummer day |
| Nettaiya | 熱帯夜 | ≥ 25°C (overnight low) | Tropical night |
| Mōshobi | 猛暑日 | ≥ 35°C | Fierce-heat day |
| Kokushobi | 酷暑日 | ≥ 40°C | Cruelly hot day |
The JMA says the new designation will “effectively call for vigilance” — signalling to the public that 40°C is not merely an extreme version of ordinary heat but a categorically different and life-threatening condition.
The summer that made the word necessary
In 2024, nine JMA stations recorded at least one day at or above 40°C — the most since records began. The events were concentrated in a single brutal day, 29 July, when six inland Kanto stations crossed the threshold simultaneously. The hottest reading that summer was 41.0°C at Sano (佐野), Tochigi.
| Date | Station | Prefecture | °C |
|---|---|---|---|
| Jul 7 | Shizuoka | Shizuoka | 40.0 |
| Jul 29 | Sano | Tochigi | 41.0 |
| Jul 29 | Tatebayashi | Gunma | 40.2 |
| Jul 29 | Isesaki | Gunma | 40.1 |
| Jul 29 | Kumagaya | Saitama | 40.0 |
| Jul 29 | Koga | Ibaraki | 40.0 |
| Jul 29 | Tenryu | Shizuoka | 40.2 |
| Aug 9 | Kuwana | Mie | 40.4 |
| Aug 16 | Mino | Gifu | 40.0 |
The chart below plots every daily maximum at Tokyo, Osaka, Kofu (甲府), and Sano (佐野, Tochigi) — Sano was the 2024 peak station at 41.0°C on 29 July, the only reading that crossed the kokushobi threshold that summer.
The dashed red line marks the kokushobi threshold. Sano crossed it on 29 July — the only station in this chart to do so in 2024 — while Tokyo, Osaka, and Kofu peaked just below it.
2025: Three times as many crossings, a new national record
2025 was dramatically worse. The JMA recorded 30 instances at 25 stations where temperatures reached 40°C or above — more than three times the 2024 count. On 5 August alone, twelve stations crossed 40°C in a single day. That same day, Isesaki (伊勢崎) in Gunma Prefecture hit 41.8°C, breaking Japan’s all-time temperature record.
Show all 30 observations ▸
| Date | Station | Prefecture | °C |
|---|---|---|---|
| Jul 30 | Kaibara (丹波市) | Hyogo | 41.2 |
| Jul 30 | Fukuchiyama | Kyoto | 40.6 |
| Jul 30 | Kuse | Okayama | 40.3 |
| Jul 30 | Nishi-Waki | Hyogo | 40.0 |
| Jul 31 | Takahashi | Okayama | 40.4 |
| Aug 1 | Kuwana | Mie | 40.4 |
| Aug 2 | Isesaki | Gunma | 40.1 |
| Aug 2 | Maebashi | Gunma | 40.0 |
| Aug 2 | Kake | Hiroshima | 40.0 |
| Aug 4 | Komatsu | Ishikawa | 40.3 |
| Aug 5 | Isesaki | Gunma | 41.8 ★ national record |
| Aug 5 | Hatoyama | Saitama | 41.4 |
| Aug 5 | Kiryu | Gunma | 41.2 |
| Aug 5 | Maebashi | Gunma | 41.0 |
| Aug 5 | Kumagaya | Saitama | 40.7 |
| Aug 5 | Koga | Ibaraki | 40.6 |
| Aug 5 | Kamisatomi | Gunma | 40.5 |
| Aug 5 | Ome | Tokyo | 40.4 |
| Aug 5 | Hachioji | Tokyo | 40.3 |
| Aug 5 | Sano | Tochigi | 40.2 |
| Aug 5 | Tatebayashi | Gunma | 40.2 |
| Aug 5 | Chichibu | Saitama | 40.0 |
| Aug 5 | Tokorozawa | Saitama | 40.0 |
| Aug 5 | Fuchu | Tokyo | 40.0 |
| Aug 6 | Shizuoka | Shizuoka | 41.4 |
| Aug 30 | Hatoyama | Saitama | 40.3 |
| Aug 30 | Kumagaya | Saitama | 40.2 |
| Aug 30 | Hamamatsu | Shizuoka | 40.2 |
| Aug 30 | Kuwana | Mie | 40.5 |
| Aug 31 | Nagoya | Aichi | 40.0 |
The chart below covers the same June–September window with the same three stations, plus Isesaki (伊勢崎, Gunma) — the station that set Japan’s all-time record of 41.8°C on 5 August 2025.
At the three charted stations Kofu reached 39.6°C in 2025 — 0.4°C short of the threshold. But the station-level picture understates what was happening nationally: 30 kokushobi-level events versus 9 in 2024, spread across more prefectures and reaching further west (Kyoto, Hyogo, Hiroshima, Aichi) than 2024’s largely Kanto-Tokai pattern.
Where the heat landed
The maps below show every station that crossed 40°C in each summer. Circle size and colour both encode temperature — yellow for 40.0°C, scaling up through orange to deep red at the national record.
The contrast is stark. In 2024 the events are tightly clustered in the northern Kantō plain. In 2025 they spread west into Kansai (Kaibara, Fukuchiyama) and Chūgoku (Kuse, Takahashi, Kake), and the Kantō cluster itself grows far denser and hotter — culminating in the deep-red 41.8°C circle at Isesaki.
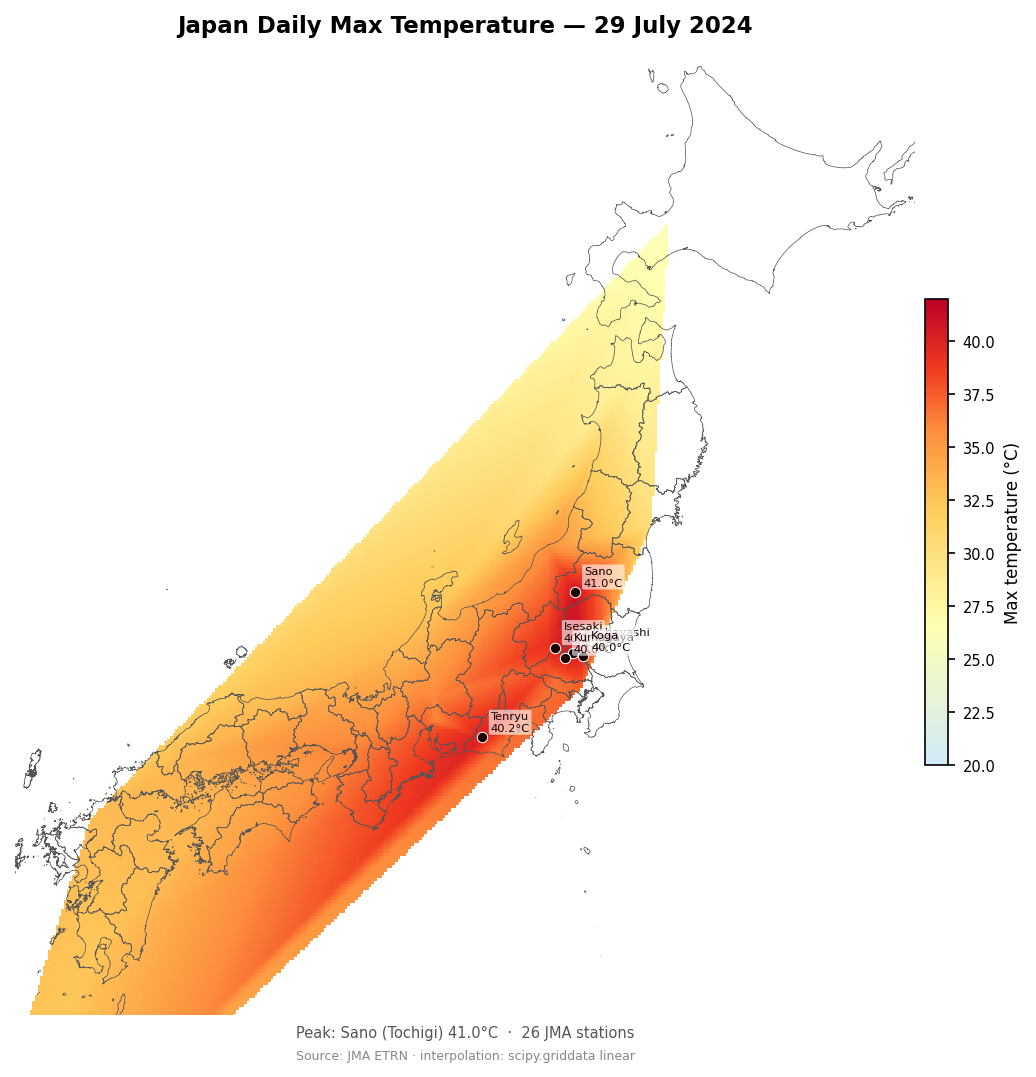
Temperature field — peak days
The maps below use scipy.interpolate.griddata (linear method) to estimate temperatures across Japan’s entire land area from the same station data, giving a continuous gradient rather than discrete circles. Prefecture boundaries are drawn from the dataofjapan/land GeoJSON in WGS84 / EPSG:4326 — the standard projection for Japan web maps.
29 July 2024 — Sano (Tochigi) 41.0°C, the summer’s hottest day:
5 August 2025 — Isesaki (Gunma) 41.8°C, Japan’s all-time record:
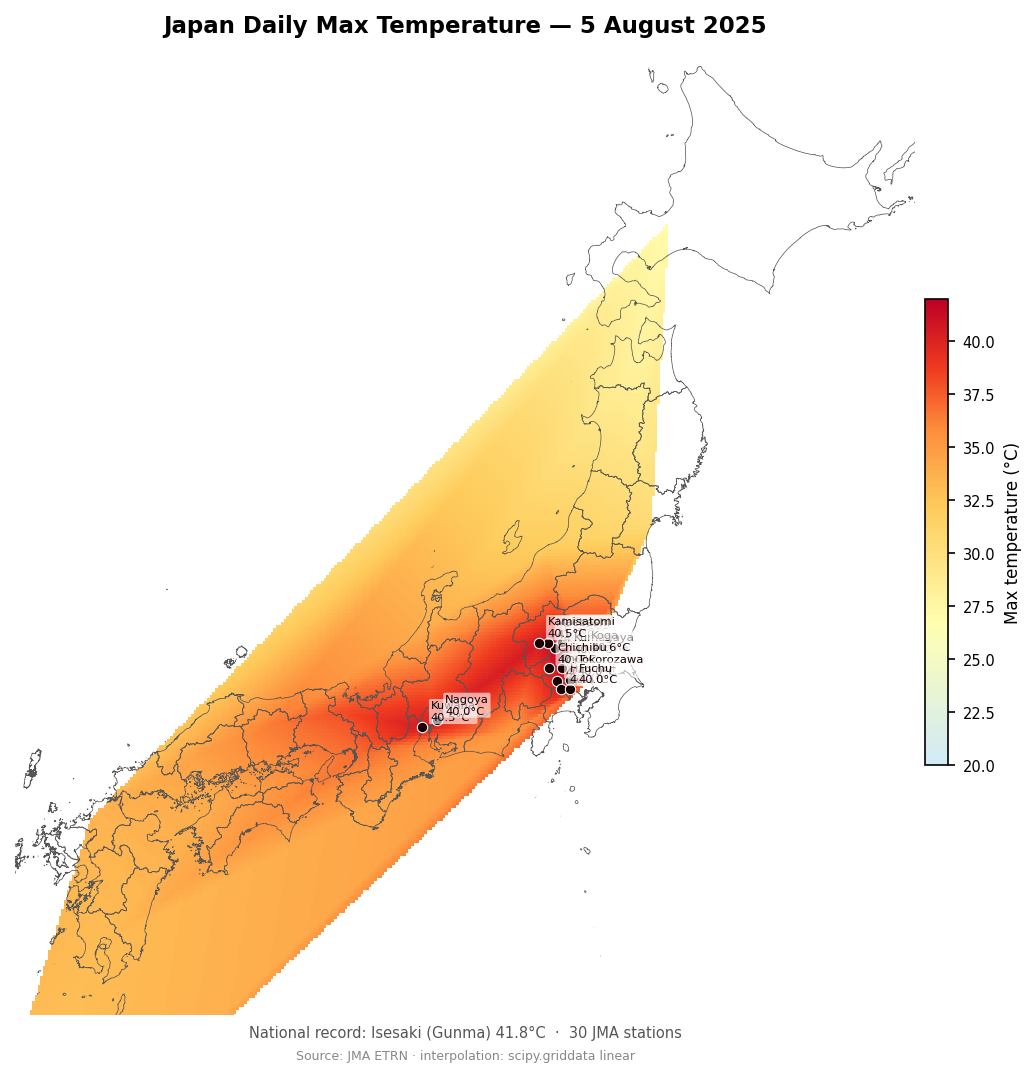
The gradient makes plain what the circle map implies: on both days the heat is not a metropolitan phenomenon but a feature of the inland Kantō basin — hemmed between the mountains of Nikkō to the north and the Ōu range to the west, channelling hot, dry air onto the flat lowlands of Saitama and Gunma.
Why these two years matter
The proximate causes are familiar: a strengthened Pacific High, reduced cloud cover, urban heat island effects amplifying record sea-surface temperatures. The structural cause is also familiar: background warming has shifted Japan’s entire summer temperature distribution roughly 1.5°C above the 1990 baseline.
What the data across both years shows is not just record peaks but an accelerating count. Nine events in 2024 was already unprecedented. Thirty events in 2025 — including a new national record — suggests the distribution has shifted enough that kokushobi days are no longer rare anomalies. The JMA coined the term expecting it would be needed. It was needed immediately.
A name is a policy instrument
Language matters in public health. Studies of typhoon preparedness have repeatedly shown that named, categorised threats drive faster and more consistent protective behaviour than numerical warnings alone. The JMA’s decision to coin kokushobi is a communications strategy: give the thing a name and people will remember what the name means.
It is also an acknowledgement. The old vocabulary, built in a cooler era, no longer fits the weather Japan is living through. Adding a rung at the top of the ladder is not an act of resignation — it is the necessary precondition for talking clearly about what is coming.
How this was built
The charts and maps in this post are pure inline SVG — no JavaScript, no external libraries. The underlying data was fetched from JMA’s ETRN portal and the coordinates were computed in Python.
The full implementation is available at code/fetch_jma.py. The key pieces are explained below.
Fetching JMA daily temperature data
JMA exposes daily station data through a predictable URL pattern. The script pulls the full June–September window for any station and writes CSV to stdout:
1
2
python3 code/fetch_jma.py                  # print to terminal
python3 code/fetch_jma.py > summer.csv     # save to file
The core parser extracts the 最高気温 column (index 7) from each data row:
Show code ▸
1
2
3
4
5
6
7
8
9
10
11
12
13
14
15
16
17
18
19
20
21
22
23
24
25
26
27
28
29
30
31
32
33
34
35
36
37
38
39
40
41
42
43
44
45
46
47
48
49
50
51
52
53
54
55
56
57
58
59
60
61
62
import urllib.request
from html.parser import HTMLParser

ETRN = "https://www.data.jma.go.jp/stats/etrn/view/daily_s1.php"

class MaxTempParser(HTMLParser):
    """Extract daily maximum temperature (最高気温) column from JMA table."""
    def __init__(self):
        super().__init__()
        self._in_td = False
        self._col = 0
        self._row = []
        self.rows = []         # list of (day, max_temp)
        self._target_col = 7  # 0-indexed: 日|現地気圧|海面気圧|降水合計|降水最大1h|降水最大10m|気温平均|気温最高

    def handle_starttag(self, tag, attrs):
        if tag == "tr":
            self._row = []
            self._col = 0
        if tag == "td":
            self._in_td = True

    def handle_endtag(self, tag):
        if tag == "td":
            self._in_td = False
            self._col += 1
        if tag == "tr" and self._row:
            self.rows.append(self._row[:])

    def handle_data(self, data):
        if self._in_td:
            self._row.append(data.strip())


def fetch_monthly(prec_no: int, block_no: int, year: int, month: int) -> list[float]:
    url = (f"{ETRN}?prec_no={prec_no}&block_no={block_no}"
           f"&year={year}&month={month}&day=1&view=")
    with urllib.request.urlopen(url) as r:
        html = r.read().decode("utf-8", errors="replace")
    parser = MaxTempParser()
    parser.feed(html)
    temps = []
    for row in parser.rows:
        if len(row) > parser._target_col:
            try:
                temps.append(float(row[parser._target_col]))
            except ValueError:
                pass
    return temps


def fetch_summer(prec_no: int, block_no: int, year: int) -> list[float]:
    """Return daily max temps for June–September of the given year."""
    data = []
    for month in [6, 7, 8, 9]:
        data.extend(fetch_monthly(prec_no, block_no, year, month))
    return data


# Example: Tokyo station (prec_no=44, block_no=47662)
tokyo_2024 = fetch_summer(44, 47662, 2024)
print(f"Tokyo 2024 peak: {max(tokyo_2024):.1f}°C")
Computing SVG polyline coordinates
Once the daily values are in a flat list, mapping them to SVG pixel space is straightforward — define the chart bounds, then linearly interpolate.
Show code ▸
1
2
3
4
5
6
7
8
9
10
11
12
13
14
15
16
17
def make_polyline(
    temps: list[float],
    chart_l=55, chart_r=740,
    chart_t=40, chart_b=320,
    temp_min=20, temp_max=42,
) -> str:
    n = len(temps)
    points = []
    for i, t in enumerate(temps):
        x = chart_l + i * (chart_r - chart_l) / (n - 1)
        y = chart_b - (t - temp_min) * (chart_b - chart_t) / (temp_max - temp_min)
        points.append(f"{x:.1f},{y:.1f}")
    return " ".join(points)


polyline_pts = make_polyline(tokyo_2024)
svg_fragment = f'<polyline points="{polyline_pts}" fill="none" stroke="#4e79a7" stroke-width="1.5"/>'
Projecting stations onto a Japan map
For the heatmap, station coordinates (latitude, longitude) are converted to SVG pixels using an equirectangular projection corrected for the cosine of the mid-latitude.
Show code ▸
1
2
3
4
5
6
7
8
9
10
11
12
13
14
15
16
17
18
19
20
21
22
23
24
25
26
27
28
29
30
31
32
33
34
35
36
import math

LAT_MIN, LAT_MAX = 30.5, 45.5
LON_MIN, LON_MAX = 129.0, 146.0
PANEL_W, PANEL_H = 300, 370
MARGIN = 20

def svg_x(lon: float, offset: float = 0) -> float:
    return offset + MARGIN + (lon - LON_MIN) / (LON_MAX - LON_MIN) * PANEL_W

def svg_y(lat: float) -> float:
    return MARGIN + (LAT_MAX - lat) / (LAT_MAX - LAT_MIN) * PANEL_H

def temp_color(t: float) -> str:
    if t >= 41.5: return "#c00000"
    if t >= 41.0: return "#d83000"
    if t >= 40.5: return "#e86000"
    if t >= 40.2: return "#f09000"
    return "#f0c040"

stations = [
    (36.32, 139.20, 41.8, "Isesaki"),
    (36.00, 139.32, 41.4, "Hatoyama"),
    # …
]

circles = []
for lat, lon, temp, name in stations:
    x = svg_x(lon)
    y = svg_y(lat)
    r = 3 + (temp - 40) * 7          # radius scales with excess above 40°C
    c = temp_color(temp)
    circles.append(
        f'<circle cx="{x:.1f}" cy="{y:.1f}" r="{r:.1f}" '
        f'fill="{c}" fill-opacity="0.85" stroke="white" stroke-width="0.7"/>'
    )
The island polygon coordinates are computed the same way — a list of (lat, lon) coastal waypoints fed through svg_x / svg_y — and the resulting pixel strings are dropped directly into <polygon points="…"> elements. No rendering engine, no canvas: everything resolves to a static string that Jekyll embeds as-is.
References
News & announcements
- NHK Web News — 酷暑日とは? 気象庁が新しい用語を制定 (April 2026)
- The Japan Times — JMA introduces new name for days of 40°C heat (April 17, 2026)
- Nippon.com — Japan’s Highest Temperatures: New Record of 41.8°C Set in August 2025
JMA — stations above 40°C
JMA ETRN — daily temperature data (main stations, daily_s1)
- Tokyo — 東京 (prec_no=44, block_no=47662)
- Osaka — 大阪 (prec_no=62, block_no=47772)
- Kofu — 甲府 (prec_no=49, block_no=47638)
JMA ETRN — daily temperature data (AMeDAS stations, daily_a1)
- Sano — 佐野, Tochigi (prec_no=41, block_no=1018) — 2024 peak: 41.0°C on Jul 29
- Isesaki — 伊勢崎, Gunma (prec_no=42, block_no=1021) — 2025 national record: 41.8°C on Aug 5